
Why Installation Time Benchmarks Matter
Time on site is the primary cost driver in fiber installation operations. Technician labor, vehicle costs, and scheduling overhead all scale with job duration. An operator who averages 30 minutes longer per job than a well-run peer is not just slower. They are completing fewer jobs per technician per day, paying more per activation, and creating downstream pressure on scheduling capacity that compounds as the subscriber base grows.
Benchmarks give operators a way to answer a question that field data alone cannot: is our installation time a reflection of job complexity, or is it a sign of process inefficiency? Process inefficiency has operational fixes. Genuine complexity requires different resourcing. Mixing them up leads operators to solve the wrong problem.
What Good Looks Like: Benchmark Times by Phase
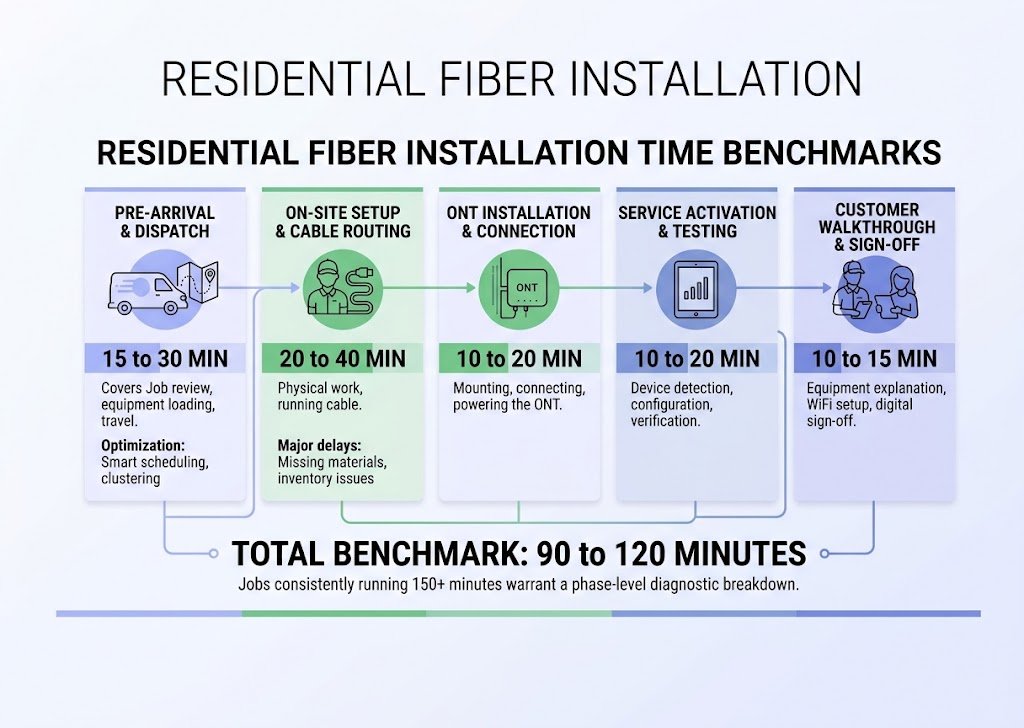
A residential fiber installation has several distinct phases. Understanding where time goes at a phase level is more useful than looking at total job time alone.
| Installation Phase | Benchmark Time | What It Covers |
| Pre-arrival and dispatch | 15 to 30 minutes | Job review, equipment loading, and travel. Kept low by smart scheduling and geographic clustering. |
| On-site setup and cable routing | 20 to 40 minutes | The physical work of running cable. Delays are usually caused by missing materials or inaccurate inventory. |
| ONT installation and connection | 10 to 20 minutes | Mounting, connecting, and powering the ONT. |
| Service activation and testing | 10 to 20 minutes | Device detection, configuration, and verification. Operators using AEX Software execute this across ten OEM ecosystems via zero-touch provisioning. |
| Customer walkthrough and sign-off | 10 to 15 minutes | Equipment explanation, WiFi setup guidance, and digital sign-off. |
| Total Benchmark | 90 to 120 minutes | Jobs consistently running 150+ minutes warrant a phase-level breakdown. |
What Drives Variance Above the Benchmark
Several operational factors push installation time above the benchmark range consistently. In almost all cases, the root cause is the gap between disconnected tools.
- Poor routing and geographic dispatch: When technicians are not dispatched in geographically clustered sequences, travel time inflates the effective cost of each installation.
- Connectivity drop-outs: Jobs in basements or rural routes often stall because the technician's mobile tool loses signal. A native app built on an offline sync-and-merge engine ensures the job does not stop and that photos, signatures, and GPS-stamped asset conditions come back to the back office in real time once signal is restored.
- Manual provisioning workflows: Operators who cannot complete provisioning on-site either leave jobs technically open or require a second visit. Closing the job in the field should trigger zero-touch provisioning automatically. A completed installation provisions the device. Nobody in the middle.
- The Handoff Gap: The calendar, the spreadsheet, and the paper job card that never make it back to the back office create coordination overhead that eats into installation efficiency.
Benchmark Comparison: Manual vs Automated Operations
The operational gap between manual and automated field operations shows up clearly in installation time data.
Operators running partially digitized workflows, where work orders are printed or provisioning is handled by a separate team, consistently run in the 150 to 180 minute range for residential installations.
Operators running fully connected field operations run in the 90 to 110 minute range for the same physical installation. Operators running AEX Field Service natively sustain 3 to 5 installs per technician per day, a 2-3x improvement over legacy setups. The difference is not technician skill. It is the elimination of manual handoffs.
Multi-Dwelling Unit and Business Installations
Residential benchmarks do not apply cleanly to multi-dwelling unit (MDU) or business fiber installations.
MDU installations vary significantly based on whether building infrastructure is already in place. A building with existing fiber conduit may add only 20 to 30 minutes over a standard residential job. A building requiring new riser cable runs is a multi-hour job by nature.
Business fiber installations, particularly those involving static IP configuration or managed router setup, add configuration time. A reasonable benchmark for a standard small business installation is 150 to 210 minutes.
The practical approach is to maintain separate time benchmarks for residential, MDU, and business installation types.
Using Benchmark Data to Improve Operations
Benchmarks are only useful if they connect to operational decisions. Total job time is a lagging indicator. Phase-level time data is a diagnostic tool.
The most productive way to use installation time data is to identify the specific phase where variance is highest, then close the system handoff causing it. To see how these stages connect without integration gaps, operators can explore How AEX Works. When you run AEX Field Service natively alongside AEX Software, every completed step simply triggers the next. A closed job triggers provisioning and same-day billing with no one touching anything in between, resulting in a 60%+ faster time to invoice.
Frequently Asked Questions
How long should a residential fiber installation take? A standard residential fiber installation should complete in 90 to 120 minutes in a well-run operation. Jobs consistently running above 150 minutes typically indicate a process, equipment, or dispatch inefficiency rather than genuine job complexity.
What is the most common cause of slow fiber installations? The most common causes are manual handoffs between systems: manual provisioning workflows that leave activation incomplete, inaccurate equipment inventory, poor geographic routing, and paper-based data collection.
How does zero-touch provisioning affect installation time? It eliminates the wait for remote NOC activation. The device is configured and connectivity is verified before the technician can close the job. This ensures the technician leaves a live installation rather than a pending one, eliminating repeat truck rolls for unfinished provisioning.
What is a good installation throughput rate for fiber technicians? Operators running native field execution platforms like AEX Field Service sustain 3 to 5 installs per technician per day, representing a 2-3x improvement over operators using disconnected scheduling and provisioning tools.
How should operators benchmark MDU and business fiber installations? MDU and business installations should be benchmarked separately from residential jobs because their complexity profiles are fundamentally different. A reasonable benchmark for a standard small business installation is 150 to 210 minutes. MDU installations vary based on building infrastructure and should be scoped individually.